Thursday 11 December 2014


Microsoft Dynamics NAV 2015 – Simplified


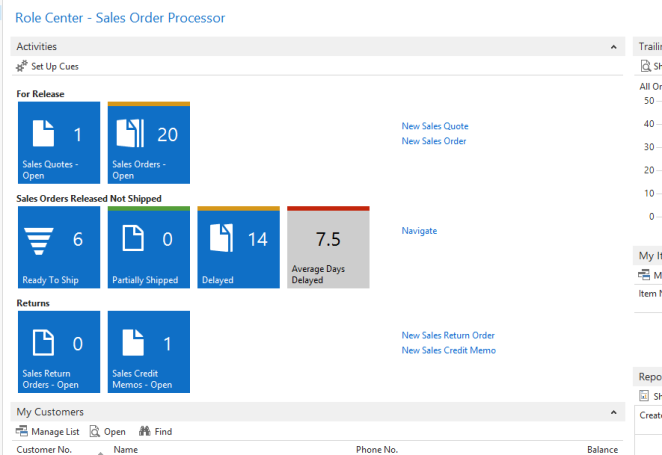
Enhanced Cues: The cues on the role center page can now have an indicator that changes color based on the data values that the tile reflects. This provides a visual signal of the status of the data based on conditions for favorable and unfavorable thresholds. The admin or the end user can setup these threshold values to show the tile indicator in red, green etc..
Enhanced Cues

Mandatory Fields: In NAV 2015, data entry is much simpler as the mandatory fields will be indicated to the end users with a Red asterisk. For example, when a end user tries to create an new customer, all the mandatory fields will be indicated as shown below:
Mandatory Fields
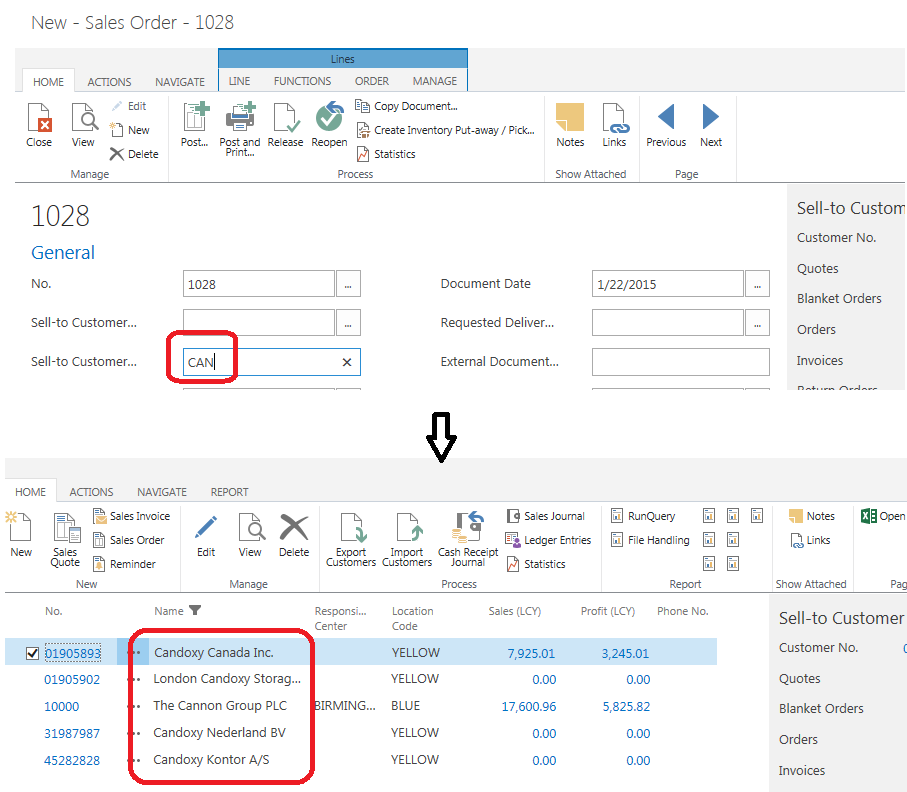
Auto-fill the No. Field: In NAV 2015, the No. field on pages like Customer card, Vendor card, Sales Order etc.. will be hidden or shown depending on certain conditions.
-The No. field is shown on all posted documents.
-When creating a document, the No. field is only hidden (Sales Invoice Picture on the left) if all the following are true:
  • One number series is assigned.
  • No related number series exists.
  • The assigned number series is set as the default, and manual entry is disallowed.
  • The next number in the series is available (it is not the last one).
In all other cases, the No. field is shown (Sales order Picture on the right).
Auto fill of No.
-Users will still be able to see the document No. in 2 places:
No. field visible at the top
Totals on Sales and Purchase Documents: An end user can now see all important information about a document directly on the document. The information will be updated when the user changes values on the document, such as quantities, prices, currencies, and discounts. The most important information that users need to see is totals and discount amounts. Therefore, all sales and purchase document pages are enhanced with information about totals, VAT, and discounts at the bottom of the page. These totals will be updated on the fly and presented to the user.
Capture7
UI Elements Removal: In NAV 2015, The system removes UI elements that are not in the user’s license or permissions set automatically. The UI is automatically simplified by only showing elements that the user can access. For example, below picture shows a sales order processor role center with all permission (Left hand side) and with very restricted permission (Right hand side).

UI Elements removal
 Simplified UX: Microsoft Dynamics NAV 2015 ships a set of simplified pages and related objects under the name of Simplified UX. Simplified UX contains simplifications with focus on basic sales and purchase scenarios for smaller businesses. Simplified UX comprises of over 100 new objects of which 63 are pages. The Simplified UX objects are part of the Starter Pack license for Microsoft Dynamics NAV 2015. Enable Small Business Role center to view all the features.
Example of Small Business Role Center is shown below:
Small Business Role Center

Simplified email with a Report Attachment: Microsoft Dynamics NAV 2015 now allows customers to quickly send sales-related files via email directly from the currently active context, both from the Microsoft Dynamics NAV Web client and the Microsoft Dynamics NAV Windows client. Sending sales documents or reports to stakeholders has never been easier, quicker, and more straightforward.
Send email with report attachment
 Microsoft Dynamics NAV for Tablets: With Microsoft Dynamics NAV 2015, Microsoft Dynamics NAV app for iPad, Android and modern Windows are available. The app allows users to get access to the data they need from the device they prefer, using a modern, fast and fluid interface designed exclusively for touch.
Dynamics NAV for Tablets
There is much more to discover in Microsoft Dynamics NAV 2015!

Dynamics NAV Web Client – Filtered look up for Document creation

For example, when creating a new sales order, type few letters of the customer’s name in Sell-to Customer No. field and you will get a filtered list as shown below. This makes choosing a customer very easy in Sales order creation process.
Sales Order Creation in Windows Client
When we try to do the same in Web client, we get an error!!
cap2
In web client, we will have to click on the assist-edit button to open the full customer list and then apply a filter on Customer Name column and choose the customer from the filtered list.
However, with a small customization, you can skip these 3 to 4 extra clicks for creating a document in web client!
I tried the following on my Cronus International database with the Sales order page. I tried with Sell-to Customer Name field instead of Sell-to Customer No. field because Sell-to Customer Name does not have any table relation specified.
In Sales Order page (42) design mode, I created a new function called GetCustNoByName. This function takes the user entered letters as input parameter and shows filtered view of customers. The end user will be able to select the required customer directly.
Function Parameter, Return value and Variables are as follows:
Function Parameter, Return value and Variables
Code within the function:
GetCustNoByName function code
Now, We need to call this function from the Sell-to Customer Name field in Sales Order page (42) to bring up the filtered list. Once the list is open, user selects the required customer. That particular customer number will be passed into CustNo (Code:20) global variable.
next, we need to validate the Sell-to Customer No. with CustNo variable, which will automatically fill up all the required fields on Sales order page.
Calling the function
Save the Page 42 after the above customization and try to create a new sales order using the web client.
This time, search for your customer on Sell-to Customer Name field and press enter to get the filtered view to select from directly:


After selecting the required customer from the list, Sell-to Customer No.Sell-to Customer Name, Addressetc… will be filled in automatically.
The GetCustNoByName function can be created in a CodeUnit and be accessed by Sales Quote, Order, Invoice etc..
This method can also be used to get vendor number by name for purchase documents.


Check mark in Microsoft Dynamics NAV Reports

I created a new and simple report on Item table with the following dataset:
Untitled1
In the layout design, I used a table control to display the data in the body section and I used a text box control to show the title of the report in the header:
untitled2
Note: To learn how to use a table control see the video: How to: Build a simple list report in Microsoft Dynamics NAV 2013 
I saved the report and ran it. In the report preview, boolean field values were shown as True/False instead of check mark!
Untitled3
To show the Boolean field as Check mark, I went back to the layout designer and did the following changes:
1. Opened the text box properties for the Boolean field (CostIsAdjusted) and inserted an expression for the value field as shown below:
I changed “=Fields!CostIsAdjusted_Item.Value to =IIF(Fields!CostIsAdjusted_Item.Value,Chr(254),Chr(168))
Untitled4
2. Changed the font to Wingdings for the Boolean field only:
Untitled5
After these 2 changes, I saved the report and ran it. The preview now displays check marks for Boolean field values:
Untitled6
:)
More about Microsoft Dynamics NAV reports


Interactive Sorting in Dynamics NAV 2013 Reports

In this post, I would like to explain how to add interactive sorting capability to your reports in Dynamics NAV.
I created a simple and plain customer list report with dataset as shown below in the Dynamics NAV report designer:
Capture1
In the layout designer, I used a table control to display the data in the body section and I used a text box control to show the title of the report in the header:
Capture2
Now, if we save and run this report, we would get a preview as shown in the following image:
Capture3
Here, the report is sorted on Customer No. by default (as it is the primary key of Customer table). Of course we can change the key in customer DataItem or use Tablix properties to sort on different fields/columns.
However, it can be made more user friendly by letting the end users choose, how the report data is sorted.
1. Open the report layout designer, right click on Name column and open Text box properties.
2. Click on Interactive sorting on the left side and enable interactive sorting. You can specify weather you want to sort on detail rows or groups. You also need to specify the Sort by column.
Follow the above 2 steps on other columns to enable interactive sorting on multiple columns.
Capture4
After enabling interactive sorting, the report preview looks as shown below:
Capture5
More about Microsoft Dynamics NAV reports.

Toggle Visibility in Microsoft Dynamics NAV Reports

To start with, I have a simple Customer list report dataset as shown below:


Capture1
In my report object, I defined 2 global variables:
CountryRec is a Record variable pointing to Country/Region table and CountryName variable of type text(100).
CountryName is calculated on the OnAfterGetRecord() trigger of the customer DataItem:
Capture2

In the Visual Studio Layout Designer, I used a table control to display the data in the body section and I used a text box control to show the title of the report in the header.
Next, to group the customer list country wise, Under row groups, right click on Details group, select Add group and Parent group.
Capture3


Select Group by Country, optionally you can choose to Add a group header and click on OK.
Capture4
Now we have a simple customer list which is grouped on country.
The report preview looks like below:
Capture5
When the report data is huge, you might find it difficult to search for relevant data quickly.
For example, if you want to search for customers in South Africa, you have to scroll down/search multiple pages to get the required data.
However, Toggle visibility feature proves to be helpful in such cases.
In the Visual studio layout designer, right click on Details row group to open Group Properties window. Choose Visibility on the left hand side to set the Toggle visibility property. By default if you want to hide all the data, select option Hide under When the report is initially run.
Enable the Toggle Visibility (Display can be toggled by this report item) option. We also need to select the item on which the display is toggled. Hence, select Country from the drop down. Click on OK and save the layout.
Capture6
Now, when you run the report, the preview hides all the data by default.
However, You will be able find the relevant country quickly and expand it to find more details. The below image shows the output where only South Africa data is expanded. You can click on the small + mark for more details under each group.
Capture7
This is another useful interactive report property which lets the end users expand and collapse data on the reports.

Dynamics NAV Report – Go To URL

Microsoft Dynamics NAV Reports are Interactive. along with features like Interactive sorting, Toggle visibility, it is also possible for end users to open hyperlinks and drill down into details by opening pages and reports from a report preview!
In the below picture, the main report is a customer list report and it is outlined with a red border. This main report has hyperlinks, links to open customer card page and Customer – Detail Trial Bal. report.
Untitled2
In this blog, I’m going to explain how to enable these links on the NAV report.
The report dataset is simple and it is shown in the below picture. Also, I have skipped all the customers who do not have home page filled by writing a small piece of code on OnAftergetRecord() trigger.
Capture1
Whenever a NAV report has links on it, it is important to enable them by setting the EnableHyperLinksreport property.
Capture2
Next, open the Visual studio layout designer. In the body section, use a Table to insert customer data as shown below:
Untitled3
Change the Font color for Home Page, Customer Card Link (Exp) and Balance textboxes through Text Box Properties.
Capture3
Next, We need to specify the Action for these 3 textboxes.
1. To open customer web site/home page from a report when the web site address is stored in Home Page field of Customer table.
Open Text box properties for Home Page text box, select Action, choose Go To URL. Under Select URL, choose [HomePage] and OK.
Capture4
2. To open customer card (21) page from a report.
Open Text box properties for Customer Card Link text box which has Expression: =”Edit Customer “+Fields!No_.Value, select Action, choose Go To URL. Click on Fx button next to Select URL to enter the expression: =”dynamicsnav://///runpage?page=21&filter=Customer.%22No.%22:”+Fields!No_.ValueClick on OK to save this action.
With this expression, we are telling the report to open Page 21 (Customer card) with filter on Customer No. = current Customer No. on the report.
Capture7
3. To Open Customer- Detail Trial Balance (104) report from the current report.
Open Text box properties for Balance text box , select Action, choose Go To URL. Click on Fx button next to Select URL to enter the expression: =”dynamicsnav:////runreport?report=104&filter=Customer.%22No.%22:”+Fields!No_.ValueClick on OK to save this action.
With this expression, we are telling the report to open a new report 104 (Customer – Deatil Trial Bal.) with filter on Customer No. = current Customer No. on the report.
Capture6
Save the report and run it to see the links work :)


Microsoft Dynamics NAV and Power BI – Schedule Report Refresh

1. In Microsoft Dynamics NAV 2013/2015, create a Query/Page object with all the required data for your Power BI report. For example, NAV 2015 create a Query with Sales Invoice details as shown below in NAV 2015:
Capture 1
2. Publish the Query/Page as a Web service in Microsoft Dynamics NAV:
Capture 2
3. Test the availability of web service: Copy the OData URL from the NAV web services window and paste it in web browser and make sure the data from NAV is available.
Capture 3
4. It is important to remove/get rid of the certificate error on your client machine. To do this, open the web browser as Administrator and paste the link again. Click on Certificate error and Install Certificate.
Capture 4
5. Open Microsoft Excel 2013 and Install Power BI add-ins (Power Query, Power Pivot, Power View and Power Map) and import data using Power Query.
Note: PowerPivot and Power View will be available by default in Excel 2013, but you will have to download and install the Power Query and Power Map add-ins first (These add-ins are available for free). Once these 2 add-ins are installed, you can open Excel 2013 and click on File –> Options –> Add-ins –> COM Add-ins (Manage drop down) –> Go –> Enable all 4 add-ins here. Two new tabs called Power Query and Power Pivot will be visible in Excel after enabling the add-ins.
Open Power Query tab and click on From Other Sources and select From OData Feed.
Capture 5
6. Enter the NAV web service URL:

Capture 6
7. Select the URL:
Capture 7
8. Next choose the authentication. Example: If the NAV authentication is NAVUserPassword, Open Basic tab and enter the NAV user ID & Password and click on Save.
Capture 8
9. The Query Editor opens up with all the web service data from NAV. You can modify the data here to suit your report requirement:
Capture 9
10. After all the changes in the Query editor, close and load the data to excel worksheet or Power Pivot. In this example, I have selected Close and Load To.. option. :
Capture 10
11. When you try to load the data to Power Pivot, you need to specify few parameters before loading successfully. Click on Load button to load the data to Power Pivot.
Capture 11
12. Next, you can create a report using this data. Foe example, create a simple PowerView chart to showcase Country wise sales as shown below:
Capture 12
13. Click on new sheet in excel workbook and copy Connection string and save it in Notepad (We will use this later):
Capture 13
14. Save this excel report on your computer (SampleChart.xlxs)
15. Create Gateway: Login to Power BI site and open Power BI admin center on the NAV server machine (It is important to login to Power BI on NAV server machine). Start with creating a newGateway:
Capture 14
16. Specify a Gateway name and click on Next:
Capture 15
17. Click on Next on Gateway instances tab.
18. On the install and register tab, click on download to download the Data gateway Management Client and install it on the NAV server machine.
19. Copy the Gateway Key into a Notepad
Capture 16
20. Run the Data Gateway Management Client (Installed in Step 19) on the NAV Server machine and enter the gateway key copied in previous step.
Capture 17
21. Click on Register
22. Select Use Service generated Certificate to create a new certificate. [Enter password and store the certificate]
23. Click on Finish to complete the creation of Gateway.
Capture 18
24. Create Data Source: In Power BI admin Center, create a new Data source:
Capture 19
25. Select Power Query from the dropdown:
Capture 20
26. Enter/Paste the connection string (Copied in step 13) and click on Next
27. Under data source info, specify a name, select the newly created gateway and click on Set credentials.
Capture 21
28. Select credential type as Basic and enter the NAV credentials and test connection.
Capture 22
29. Click on Save and Next
30. Under users and groups, you can add the users that are allowed to access the data source to refresh Power Query worksheets.
Capture 23
31. Finish
 the creation of Data source
32. Open Power BI site and drag and drop the Excel file (Samplechart.xlsx) into Power BI site
Untitled
33. Schedule refresh for the report [on your report, click on the small 3 dots and select Schedule Data Refresh] and setup the refresh as per your requirement. To test, you can also click on save and refresh report to refresh data immediately.
Capture 24
  1. Click on History to check the status. Here you will be able to check if the report was refreshed successfully or not.
Capture 25

Microsoft Dynamics NAV 2015 – Simplified Microsoft Dynamics NAV 2015 is much more simpler and easier for the end users to work more ef...